UK local elections delivered record-breaking fragmentation of the vote
Reform UK surged to a shock victory in the 2025’s local elections, as Britain’s two-party grip shattered, with record-low vote shares and majorities revealing the most fragmented result in modern history.

What you need to know
🔹 Reform UK won 41% of local seats, dramatically outperforming both main parties.
🔹 The combined Labour and Conservative vote share fell to a historic low of 36.8%.
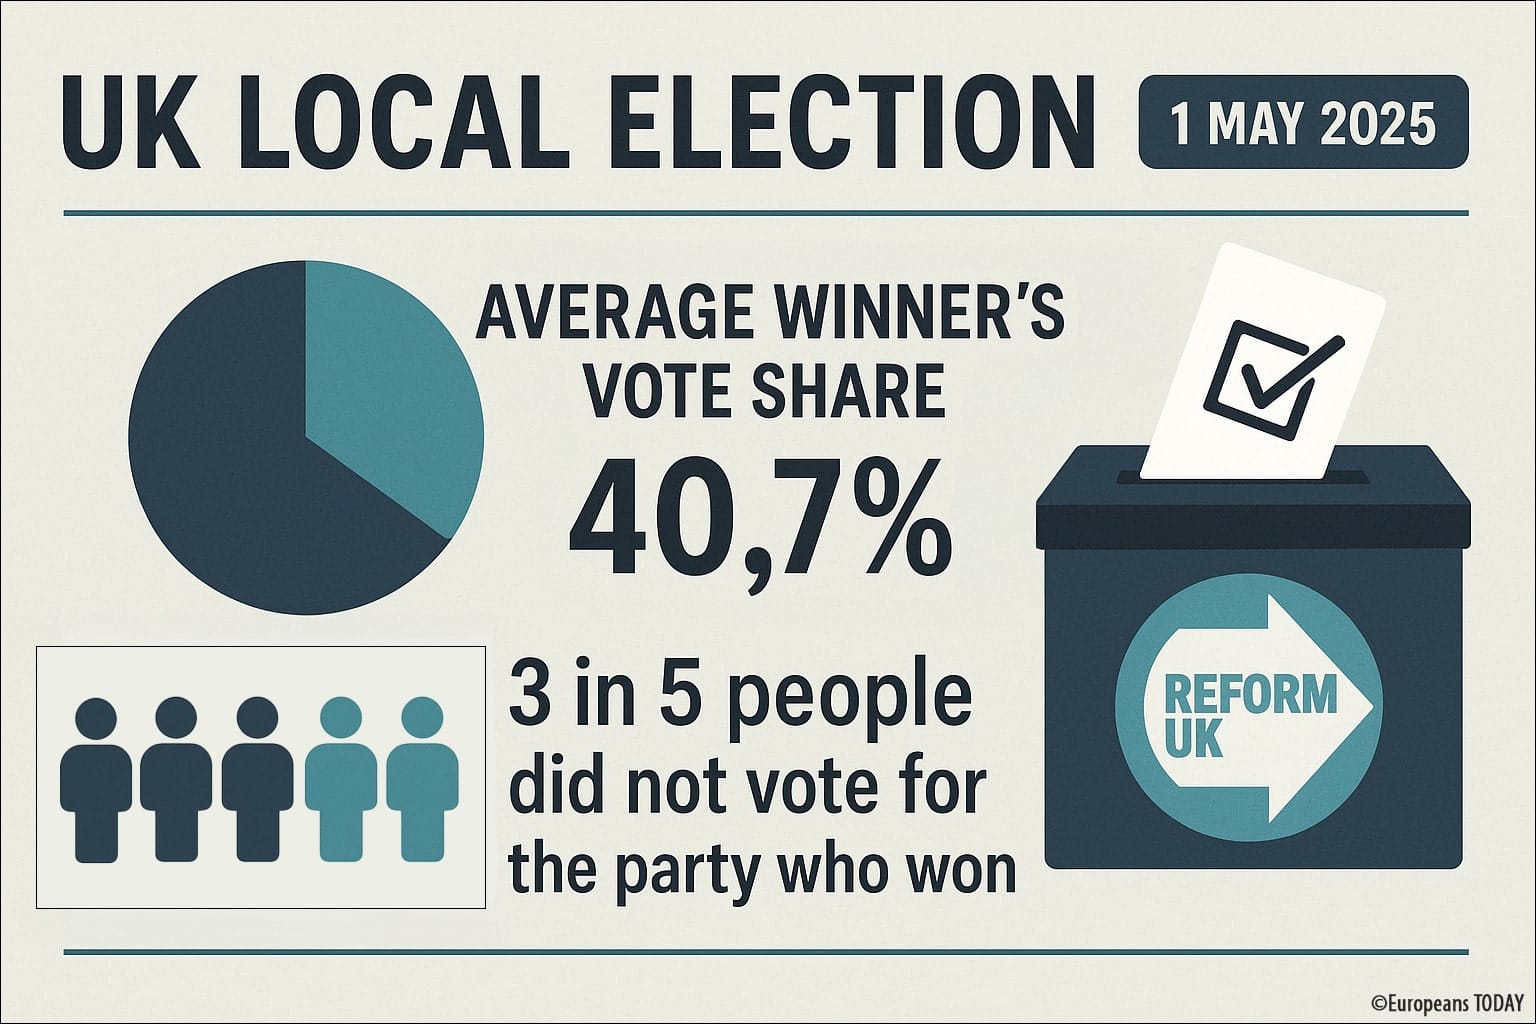
🔹 The average winning vote share dropped to 40.7%, showing broad voter dispersion.
🔹 Fragmentation peaked with an ENEP of 3.35, reflecting record multi-party competition.
I f there were such a thing as landslide victories for local elections, Reform could easily claim to have won one in 2025.
Out of the 1,641 seats available, Nigel Farage’s party came away with 677 – that’s more than 41%. The Liberal Democrats came second with 370 (+163). Overall, only a quarter of seats went to the two main parties combined – the Conservatives on 319 (-677) and Labour 98 (-189).
Looking at the ward-level results shows that the voting patterns in 2025 were very different to those seen at any other local election. It’s clear that this election broke records for the extent of fragmentation – a significant movement away from the dominance of the two parties that have dominated British politics for the past century.
There are several ways to measure this. One method is by looking at the two-party vote share, this is because fragmentation occurs when voters have a greater number of parties to choose from and opt for parties other than Conservative and Labour when casting their ballots. Analysis of 1,282 wards in the 2025 local election shows the average two-party vote share was just 36.8%. That’s the lowest it’s ever been since Labour established itself as a main party. In fact, it’s never before been lower than 50% – and the 2025 figure is a full 20% below the previous record of 56.9%, set in 2013 when UKIP did well.
— Conservative + Labour vote share across 80 years of local elections —
— How the combined vote share of the Conservatives and Labour has fluctuated across 80 years.
Another method is by looking at the vote share that the winning party received in each ward. If that’s high, it means most people rallied around a single party with their votes, whereas a low winner’s vote share means a person was elected with low levels of support from the electorate. Remember, the first-past-the-post electoral system only requires a plurality of votes, and not a majority.
— Winning vote shares across 80 years of local elections —
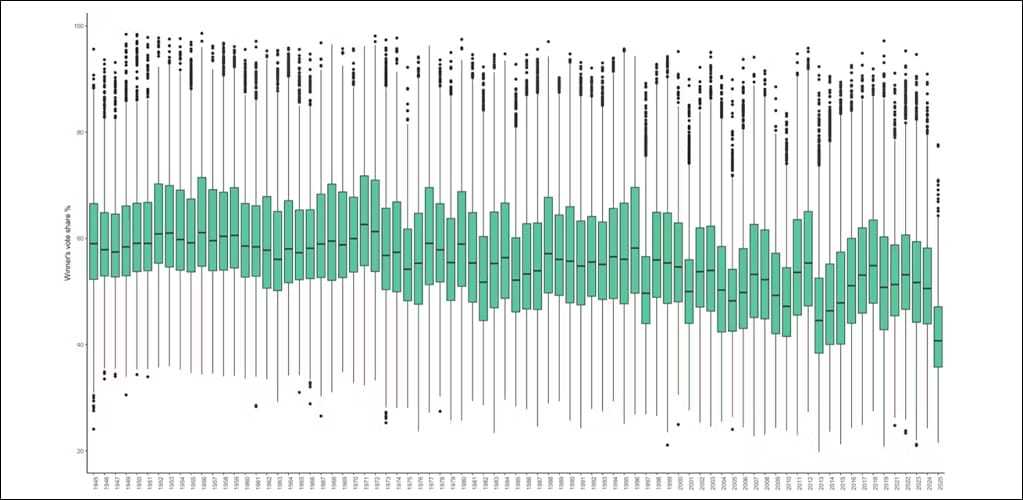
— The vote share taken by the winning party in local elections across 80 years.
Again, 2025 is the lowest in comparable history. The average winner’s vote share was just 40.7%, meaning three in five people did not vote for the party who won. The most similar years were during the height of UKIP’s popularity, in 2013 and 2014, before the announcement that the Brexit referendum would take place if the Conservatives won the 2015 general election. Whereas for the locals it was Reform who won most of the seats, at the 2024 general election it was Labour. However, in July 2024, it was the first time that the average winning party’s vote share fell below 40% in 30 years of general elections.
 // EUROPEANS TODAY
We can also observe fragmentation using the majorities secured by winning parties – if they are decisive victories, there’ll be a greater majority. The average winning majority was just 11.6% at the 2025 local election. It breaks another record, being the lowest since 1914, with 2005 and 2013 being the closest comparable years.
— Majority size across 80 years of local elections —
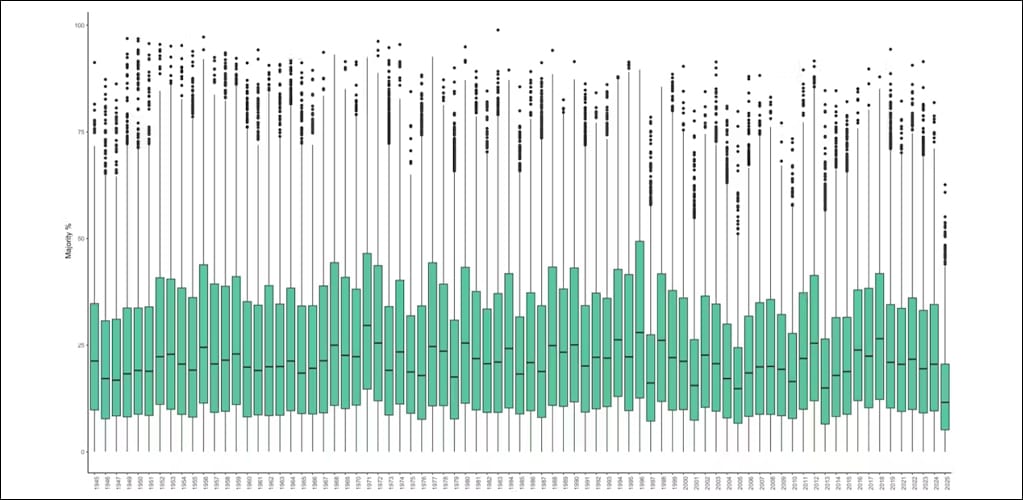
— Majorities secured by the winning party across 80 years of local elections.
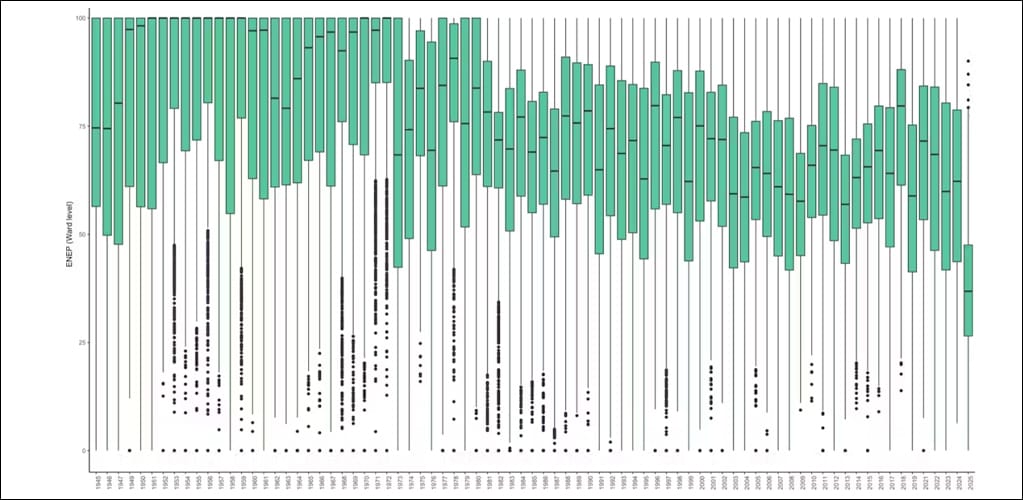
A final method considers the “effective number of electoral parties” (ENEP) at the ward level. This measure calculates how many political parties made an impact on a result, meaning that a high figure shows multiple parties received significant vote share, and a low figure denotes most people voting for a single party.
It’s no surprise that 2025 saw the highest ever average ENEP at a local election, coming in at 3.35. Only twice has this figure been above three, as in 2013 it was 3.02.
— Effective number of parties across 80 years of local elections —
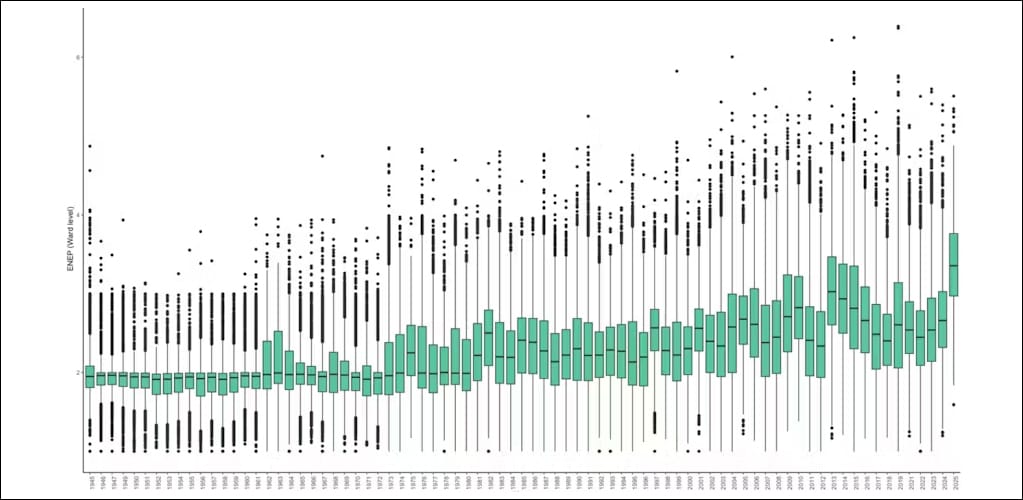
— The number of parties making an electoral impact in local elections across 80 years.
Long-term trends
I’ve been talking about the fragmentation of British electoral politics for a long time. It was the topic of my PhD thesis, which I started writing (at least in earnest) seven years ago. It’s not a new phenomenon. Its shape, however, along with its impact, has morphed over the years. We know it’s driven by a weakened attachment to political parties and that it’s exacerbated by electoral shocks. We know that it makes elections more competitive but that it decreases turnout.
The British electoral system is meant to produce decisive governments – at any level – and this tends to be centred around two main parties. This meant that for a long time the Conservatives and Labour received the overwhelming majority of all votes cast, subsequently also winning almost every seat. Those days appear to be over. First came the fragmented general election, and now it’s at the local level too.

Sources:
▪ This piece was originally published in The Conversation and re-published in Europeans TODAY on 3 May 2025. | The author writes in a personal capacity.
▪ Cover: Shutterstock/Martin Suker.